Everything you need to know about trend analysis in NPS

If there’s a single habit I recommend to any SaaS founder or product builder, it’s the regular study of your Net Promoter Score trends. I’ve made this a habit myself and watched small teams turn raw user feedback into steady growth and real retention. In this article, I’ll show you what trend analysis in NPS actually means, how to do it right, and why tools like Thrilled are making this once-daunting task simple—even for solo founders.
Understanding NPS trend analysis
I see a lot of people treat NPS as a “one-and-done” metric. But the real power, in my experience, is not just the score—it’s the story the score tells as it moves through time. NPS trend analysis means looking at how your Net Promoter Score changes over periods, so you can spot patterns before they become problems. This is not about a single number. It’s about direction, pace, and what your users are saying underneath it all.
In practice, trend analysis in NPS involves a few simple, but powerful steps:
- Consistently collecting user responses, not just once, but as a rhythm in your product.
- Tracking the score over days, weeks, or months.
- Comparing current results with previous periods.
- Digging into open-text feedback to see what’s shifting underneath those numbers.
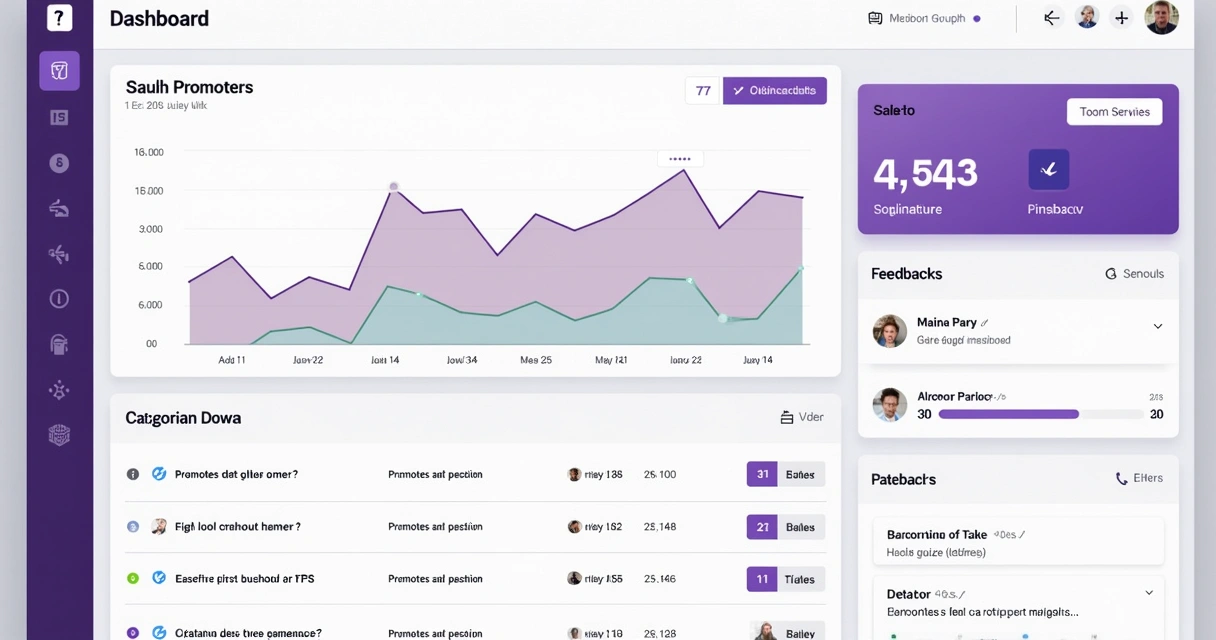
With a platform like Thrilled, the process feels natural, not overwhelming. You see your current score, your trend, and even urgent patterns in one dashboard view. No needless noise—just signal.
Why trend analysis matters more than a point-in-time NPS
When I first started in SaaS, I admit, I loved seeing a high NPS. Felt good. But that single number can be deceptive. Is it rising? Falling? Staying flat while issues bubble up underneath?
“Direction matters more than position.”
If your NPS is drifting down week after week, even by a point or two, that’s an early warning. If it’s surging, you know something is working. Spotting these shifts quickly means you can act before users drop off in silence. I’ve seen teams avoid nasty surprises by watching these trends closely. On the other side, ignoring NPS trends is like flying blind—numbers might look stable until, suddenly, they don’t.
A trend is a signal of what’s working or breaking in your product, and a scoreboard for your experiments. There’s just no shortcut for this kind of honest feedback loop.
How to approach NPS trend analysis as a founder
Every Monday, I review my NPS trends. Teams using Thrilled often receive a Slack digest or dashboard update that does the heavy lifting. The anatomy of effective trend analysis, in my book, looks something like this:
- Start by looking at your NPS graph. Are you up, down, or holding steady?
- Check the period-over-period delta (the difference since last week or month).
- Find out if a big change is due to user count, seasonality, or something new in your product.
- Go beneath the number: which feedback categories are shifting? Are bugs spiking, or is there more praise for a particular feature?
- Use urgency scoring to figure out if there’s a brewing crisis or just a few outlier opinions.
What stands out about using Thrilled is the AI-powered touch: feedback is categorized automatically, urgent comments are flagged, and you get actionable recommendations instead of a word salad.
Making trend data actionable
Trend analysis is only valuable if you turn insights into action. Here’s what’s worked for me and many small teams:
- Set a recurring review ritual. Weekly works best for most SaaS teams, monthly if your volume is low.
- Follow up on negative trends—reach out directly to detractors if possible.
- Celebrate and double down on what’s working (feature releases, improved support, etc.).
- Share trends and summaries with your team visually. A quick, color-coded chart beats a dense email every time.
Thrilled’s summaries, Slack notifications, and dashboard widgets take much of this busywork off your plate, making it possible for even the busiest founder to stay in the loop without being swallowed by spreadsheets.
Best practices I’ve learned for NPS trend analysis
In my experience, these are some of the best ways to get real results from NPS trend analysis:
- Keep your feedback request simple and timely. Don’t overwhelm users—one modal, one question, one follow-up from Thrilled is all it takes.
- Segment your results. Look at trends by user group, plan, or cohort. Sometimes a small change in one segment is masked in the overall score.
- Act fast on urgent negative feedback before it snowballs.
- Let AI do the boring work. Automated categorization and trend summaries mean you’re always looking at what matters, not just big numbers.
- Make sure your whole team sees the trend—Slack digests or dashboard access keeps everyone honest and proactive.
- Go visual. Use color-coded graphs and clean charts (Emerald for promoters, Amber for passives, Rose for detractors) to spot movement at a glance.
One key is resisting the urge to obsess over absolute NPS scores. Momentum and context ALWAYS matter more than a single value. I discuss these and other techniques in articles such as those under analytics best practices and customer experience strategies.
Common traps and how to avoid them
I’ve seen teams fall into a few predictable traps:
- Worrying too much about daily or hourly NPS “noise.” Watch trends over sensible periods—weekly or monthly. Day-to-day bumps are almost never meaningful.
- Ignoring small declines until they add up. Catch early signs by setting thresholds for alerts, something platforms like Thrilled help automate.
- Forgetting to check the “why” underneath—the themes surfacing in open-text responses. A sliding score with no story is just a mystery.
- Trying to analyze trends only at quarterly meetings. By then, it’s too late to course-correct.
If you want examples of effective feedback-to-action cycles, I always reference practical stories in posts like this product-led growth case study.
Connecting the dots with user retention and product evolution
In the SaaS world, user retention and feedback are glued together. By consistently tracking NPS trends, you know if your efforts around onboarding, bug fixes, or new features are moving the needle. When I look at the past launches or product pivots, the teams with a living NPS trend graph always spotted churn before it got dangerous, or amplified hidden wins quickly. This is why the user retention discussion always returns to NPS feedback as its core.
Wrapping up: How trend analysis unlocks better SaaS
If I had just one message for builders: NPS trend analysis is how you learn what users actually think, before they leave. With a tool like Thrilled, the process becomes simple, the noise drops away, and you’re left with clear, actionable signals and real confidence in your decisions.
Ready to keep your finger on the pulse and react before you lose users to silence? Get to know Thrilled, and make trend analysis part of your regular SaaS toolkit. To go deeper, you’ll find plenty of practical guides on modern SaaS best practices on our blog.
Frequently asked questions
What is trend analysis in NPS?
Trend analysis in NPS is the ongoing process of monitoring how your Net Promoter Score changes over time, identifying shifts, patterns, and signals in both the quantitative score and the underlying user feedback. This approach gives insight into whether changes in your product or service are having the desired effect on user sentiment.
How do I perform NPS trend analysis?
Start by regularly collecting NPS feedback from your users. Track the score on a consistent schedule—weekly or monthly works best. Review the score’s movement, study feedback themes, and use color-coded charts to quickly spot shifts. With Thrilled, AI automatically categorizes feedback and creates actionable summaries, saving you from hours of manual analysis.
Why is NPS trend analysis important?
NPS trend analysis helps you catch early signs of satisfaction or problems, react swiftly to negative shifts, and double down on what's working. It turns one-off metrics into a living, breathing pulse of your SaaS product. You get the chance to fix issues before users disappear and celebrate improvements the moment they happen.
What tools help with NPS trend analysis?
I always suggest using tools designed for SaaS founders and small teams—like Thrilled. Tools with automated tracking, AI-powered analysis, real-time dashboards, and Slack digests keep you updated with minimal effort, making trend analysis accessible even at a small scale and fair price.
How often should I analyze NPS trends?
The sweet spot, in my experience, is weekly. For slower-moving products or if you don’t have a lot of user responses, monthly reviews work. The key is to watch trends at a cadence where you can act quickly, not just react after the damage is done.